
Introduction:
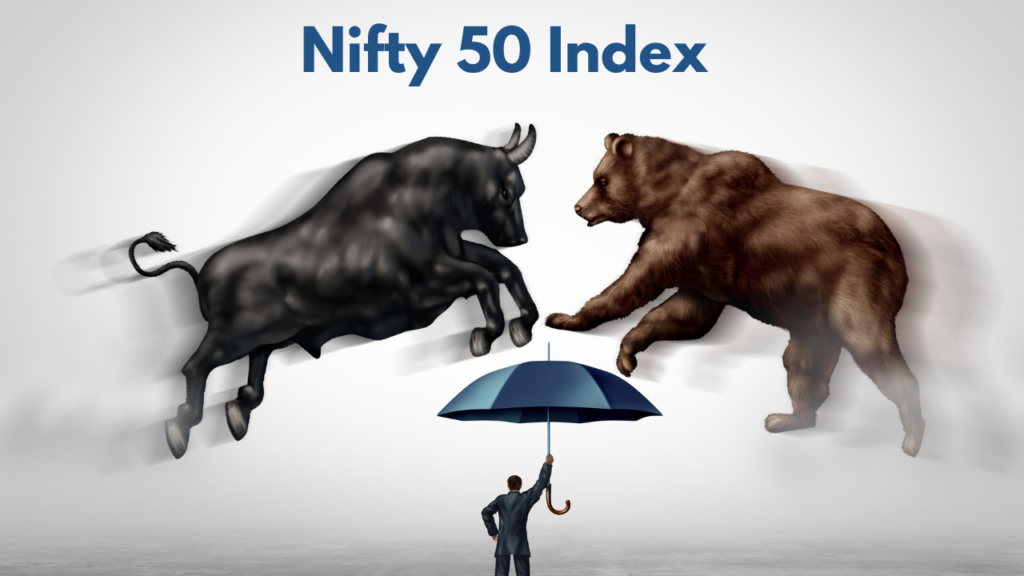
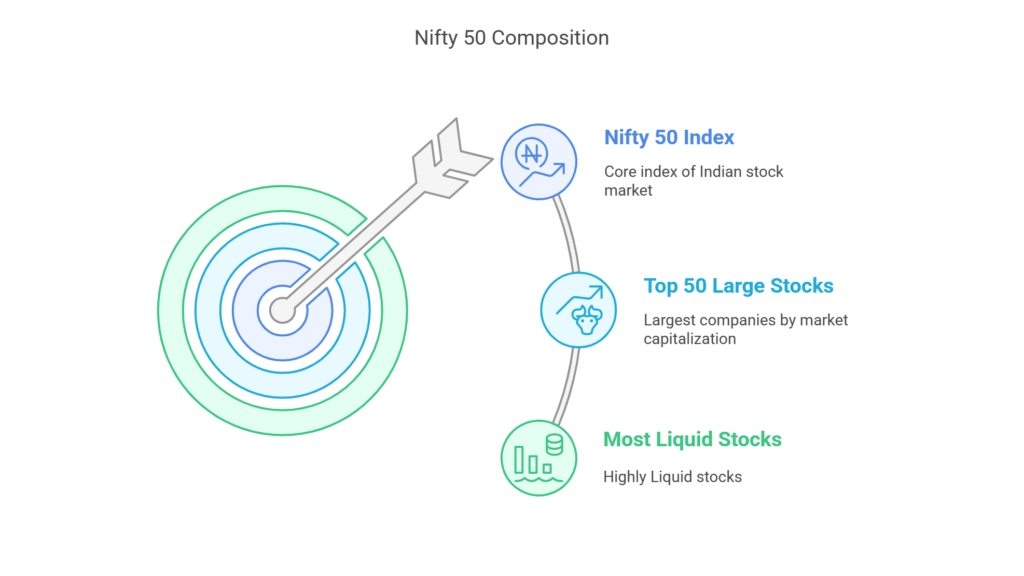
Nifty 50, short for National Stock Exchange Fifty, is the benchmark Index of the Indian Stock market. It is owned and managed by NSE Indices Limited, which is focused upon the index as its core product. The Nifty 50 index represents the performance of the Top 50, largest and the most liquid Indian companies listed on the National Stock Exchange (NSE).
Nifty 50 was launched in April 22,1996 with a base value of 1000 and a base capital of INR 2.06 trillion as of November3,1995.
Table of Contents
Understanding the Nifty 50 Index
Nifty 50 index is a carefully selected group of 50, publicly traded Indian stocks that represents approximately 54% of the free float market capitalization of all stocks listed in the NSE. These 50 companies are selected based on stringent criteria which includes their market capitalization (market-cap), liquidity, trading frequency, listing history etc., ensuring that the index reflects the true picture of the Indian Equity markets. The index is periodically reviewed and rebalanced every six months, i.e., on the last working day of March and September. This helps in maintaining relevancy and represents the current market conditions accurately, with any changes informed to the public at least four weeks in advance.
Nifty 50: Primary Benchmark Index for the Indian Stock Markets
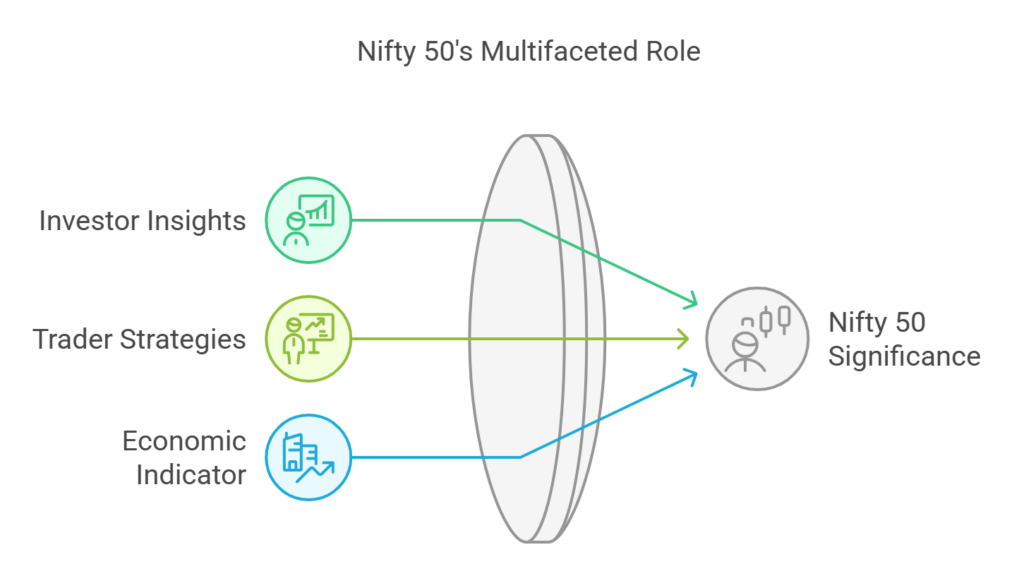
The Nifty 50 acts the primary benchmark index of the Indian Stock Markets. The movement of the index acts as a key indicator of the overall direction and the health of the Indian stock markets. All market participants closely monitor the Nifty 50 to make informed decisions. The performance of individual stocks, mutual funds, overall investment portfolio etc. are often measured against the performance of the Nifty 50 index, thus acting as a standard benchmark for evaluating their respective performances, over a given period.
The Nifty 50’s performance is influenced by number of factors like the GDP data, inflation, interest rates, corporate earnings, global market cues etc. thus making it a reliable way to understand the underlying market conditions.
Significance of Nifty 50 for Investors
Nifty50 offers several crucial benefits for investors. some of them being
- It helps getting a diversified exposure to India’s large-cap segment, thus allowing investors to participate in the India’s growth story.
- It also allows investors to get exposure to various sectors through a single index.
- Index Funds and Exchange Traded Funds (ETF’s) that tracks the index lets an investor participate in the stock markets in a cost effective and convenient way.
- An investor can use Nifty 50 as a benchmark to evaluate the performance of an actively managed equity mutual funds or stocks in his portfolio to assess if they are outperforming or underperforming the broader markets.
Significance of Nifty 50 for Traders
Traders use the Nifty 50 Futures and Options Contract for: –
- Hedging
- Speculation
- Arbitrage
This helps them to manage risk, take directional bets on the market by using sophisticated trading strategies. The liquidity in the derivative contracts of the Nifty 50 coupled with its role as a market barometer makes it an attractive instrument for traders to capitalize on from short-term price fluctuations too.
Significance for the Indian Economy
The performance of companies in the Nifty 50s often reflects the broader economic trend and business sentiment in the country. A rising Nifty 50 indicates optimism and confidence in the Indian economy whereas a decline may signal concerns about economic growth or stability. It also acts as a key reference point for foreign institutional investors (FII’s) looking to invest in the Indian equity markets with its stability and performance influencing capital inflows and overall confidence in India’s growth story.
Nifty 50 : Calculating Methodology
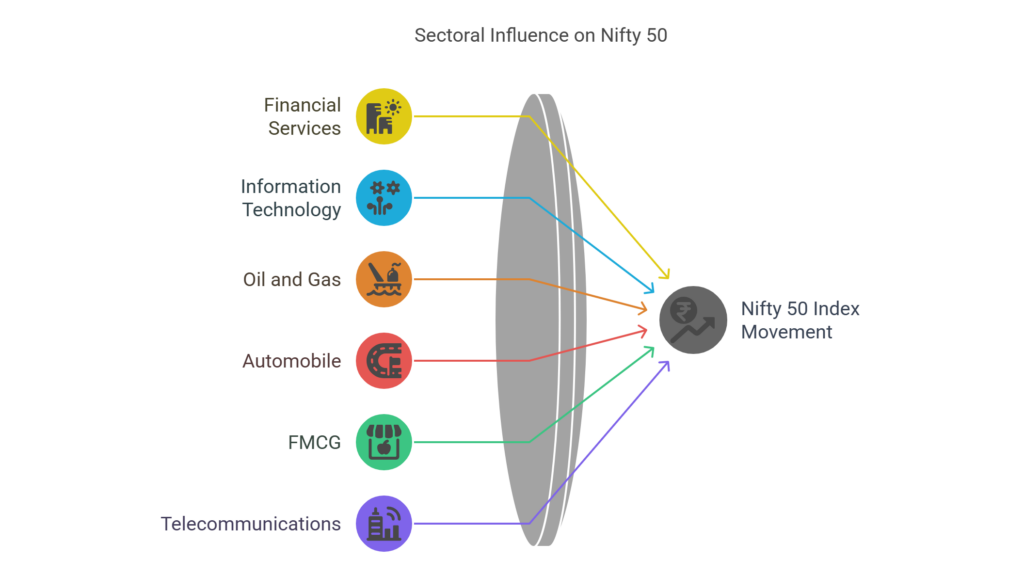
The Nifty 50 index represents various sectors of the Indian economy like the Financial services, Information Technology, Oil &gas, Consumer goods, Automobiles, Metals etc. The weightage of each stock of the index is calculated using the free-float market capitalization weighted methodology. This means it considers only shares that are readily available for trading in the market, excluding shares held by promoters, government and other categories which are locked in.
This methodology ensures larger, more liquid companies have a greater impact on the index’s overall value. The formula for calculating its value is: –
Index Value = Current Free Float Market Cap X Base Index Value
Base Market Cap
Base Index value being 1000 when launched in April 1996
Corporate actions like stock splits, rights and bonus issues etc. are adjusted overtime to ensure accuracy and continuity of the Nifty 50 index as a reliable benchmark.
The Primary Reason Behind Creating the Nifty 50 index
The primary reason behind creating the Nifty 50 index was to have an objective benchmark for measuring the performance of the largest and the most liquid companies listed on the National Stock Exchange. It also allows both foreign and domestic investors to easily gauge the overall direction of Indian equity market and create a benchmark to measure performance of other investment products vis-à-vis the Nifty 50 index.
Journey of Nifty 50
The trajectory of the Nifty 50 has been shaped by significant global events that have left a lasting impact on its journey since its inception. Events such as the The Asian Financial Crisis (1997), Dotcom bust (2000),Global Financial crisis (2008), Covid-19 pandemic (2020),periods of political instability etc. have all triggered significant volatility and uncertainty in the performance of the Nifty 50 index . Similarly, periods of strong economic growth and positive investor sentiments have pushed Nifty 50 to new highs.
The long-term growth of the index from its base value 1000 in 1995 to over 20,000 in the recent years demonstrates the tremendous value creation that Indian economy has created for investors through its economic progress. This growth has primarily been linked to growth opportunities presented by the Indian economy to investors both from within and outside India.
The Top 50 Companies and Sector Representation In Nifty 50
The Top 50 companies that constitute the Nifty 50 index can be seen from Nifty Indices website. The factsheet can also be downloaded, which more specifically gives details about portfolio characteristics, sector representation, top stocks in the index by weightage etc.
The sector with the most weightage is the Financial Services sector(~37%) followed by Information technology (~11%), Oil and Gas (~9%), Automobile and Auto-components (~6%), FMCG (~6%), Telecommunication (~4%) etc.
The Financial services sector, having the largest share in the Nifty 50 index, brings to the forefront the crucial role played by the Banks and NBFC’s, Insurance companies, Asset Management Companies etc. in the Indian economy. The Information technology sector being the second largest underlines India’s strength and prominence in the software and services space, followed by oil and gas and consumer goods which represents the rising domestic consumption.
Any change in the performance of these sectors directly impacts the movement of the index , with the heavily weighted sectors like the financial services or IT pulling the index upwards during periods of strong performances and vice versa during periods of downturn in such sectors. On the other hand, substantial gains in smaller sectors might have a limited overall effect on the Nifty 50 index.
With the passage of time, shifts in the sectoral weightage have occurred representing the shifts within the index , thus reflecting the evolving landscape of the Indian economy.
Factors Influencing the Movement of the Nifty 50
The Price movement of the Nifty 50 index is affected by interplay of a multitude of domestic and global factors. Investor sentiments and news events also affect it. A sound understanding of these factors is crucial for an investor or a trader to navigate the Indian stock markets successfully
Domestic Factors
- Corporate Earnings: The performance of the companies constituting the index is one of the primary domestic drivers. Strong quarterly or annual earnings report indicates that growth and profitability boost the sentiments of investors, leading to an upward movement in the Nifty 50 index .On the other hand , poor earnings or negative outlook drags the index down.
- Government Policies: Favorable monetary policies enacted by the Indian government like investment friendly tax policies, subsidies to certain sectors, infrastructure spending, FDI etc. can create positive sentiments attracting the attention of investors keen to invest. Conversely policies perceived to have detrimental impact can have the opposite effect.
- Political stability: A stable government boosts investor confidence and encourages long-term investments in the Indian economy. Certainty regarding the government’s tenure and its policy direction reduces uncertainty, thus supporting higher index valuations.
Global Factors
- FII’s: FII’s are the major participants in the Indian Stock market. Their investment decisions are driven by many factors, the important ones being global liquidity, their outlook on the Indian economy, political stability, regulatory changes, return on investment etc., which significantly influences the demand for stocks. Large Capital inflow pushes the prices of stocks up, thereby pushing the index up. Similarly, significant outflow can lead to selling pressure.
- Global Market Trends: An overall positive sentiment and price rally in the global indices (e.g., S&P500, Dow Jones, FTSE etc.) often has a positive impact on the Nifty 50, pushing it higher. On the other hand, global market downturns, can lead to selling pressure in Indian stocks and therefore a price correction in the index.
- Commodity Prices: Commodities like Crude oil have a substantial impact as they are imported by India for its domestic consumption. Higher crude oil prices can increase inflation, impacting the profitability of various sectors whose impacts can be seen affecting the index. Similarly, prices of other commodities like metals and agricultural products also affect the profitability of companies engaged, affecting it.
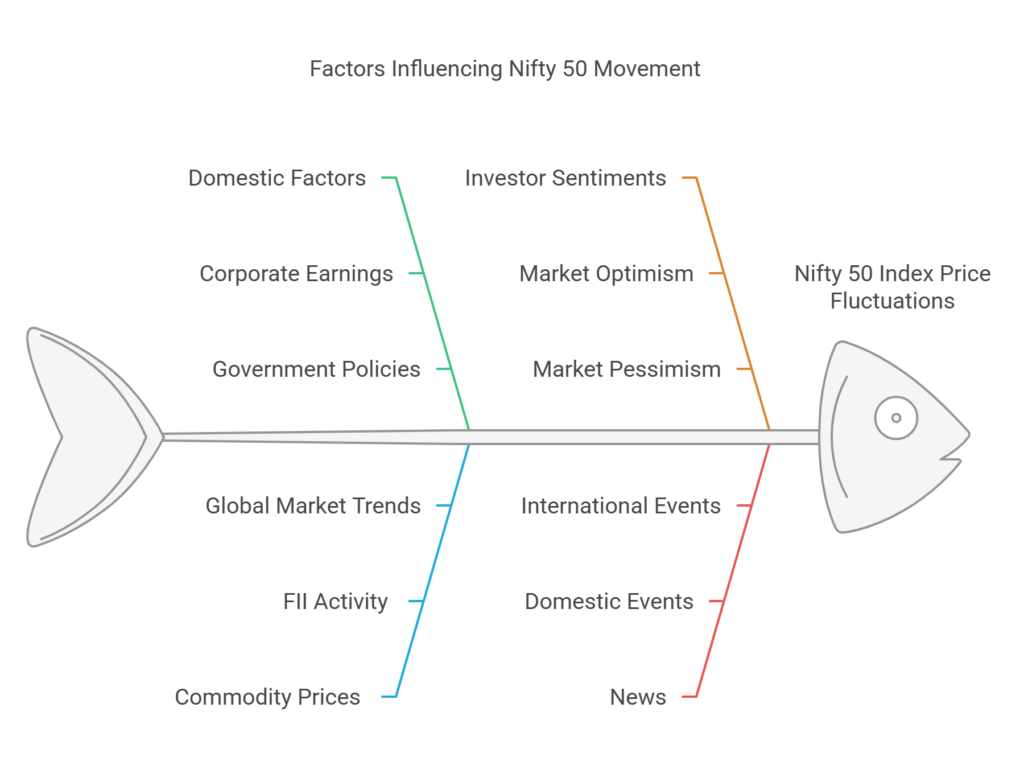
Investor Sentiments
- Investor sentiments or market sentiments are driven by a combination of factors mentioned above and the overall optimism or pessimism in the future of a country’s economy. An overall positive market sentiment can lead to higher prices and conversely negative market sentiment can lead to sharp price corrections sometimes even in the absence of any imminent development.
News
- News: Unexpected domestic or international news events like a geopolitical event, natural disasters etc. can create sudden and sharp reactions in the Nifty 50 index .A positive news can lead to sharp rallies, whereas negative news can trigger significant declines .
Limitation of Nifty 50 Index
The Nifty 50, while a crucial benchmark index , represents only a small group of companies listed in the National Stock Exchange . The NSE comprises approximately 2000 publicly listed companies operating in various sectors. These companies, belong to the Small and Mid-cap segments. These smaller companies often have a different growth trajectory and risk profile as compared to the Nifty 50 companies. Their growth potential can be significantly higher, as they may be operating in emerging industries, developing innovative products or expanding into untapped markets.
However, it is important to note that this rapid growth comes with increased volatility and risk, as they may face challenges related to regulatory changes, operational inefficiencies, lower brand recognition etc. Additionally, such companies are also more susceptible to economic downturn, market fluctuations etc. due to their relatively weaker financial cushion
It important to understand here that the index may not always catch the emerging trends or the performance of a smaller growing company that could offer better return on investment for an investor .
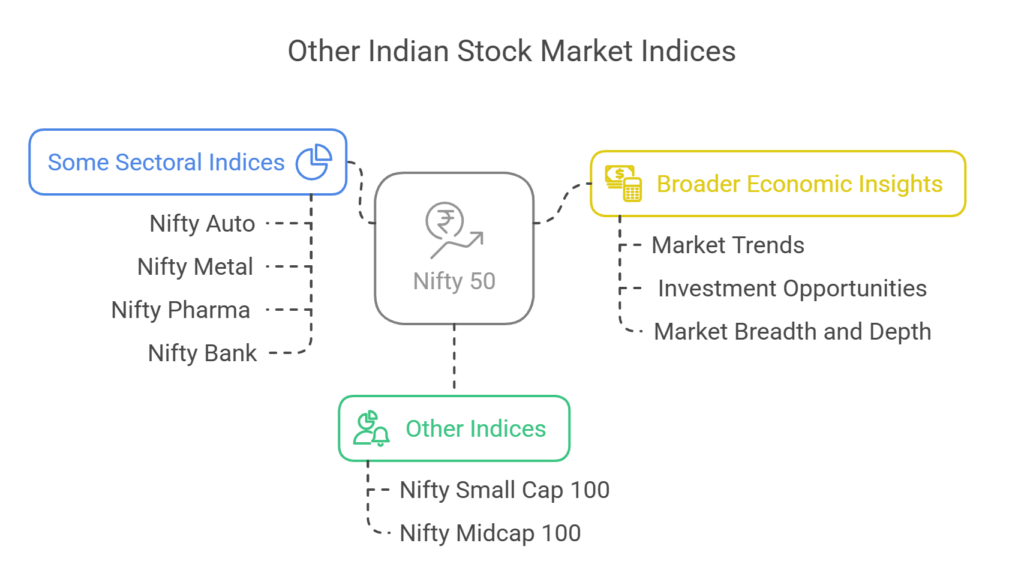
Other Indices in the Indian Stock markets
The Indian stock market has other indices that give valuable insights into different market segments. Indices like the Nifty Small cap 100 and Nifty Midcap 100 tracks the performance of small and medium sized companies. These indices help understand the broader market dynamics and the potential investment opportunities beyond the large cap companies. Sectoral Indices like Nifty Auto, Nifty Metal, Nifty Pharma, Nifty Bank etc. track the performance of stocks in a particular sector or industry. Tracking and monitoring these diverse indices help an investor better understand the market trends, identify potential investment opportunities and assess the overall market breadth and depth of market activity that the Nifty 50 alone cannot give .
In conclusion , the Nifty 50 is a vital index which helps an investor not only measure the performance of leading companies in the Indian stock markets but also in understanding the broader economic landscape . Understanding its history , composition , the factors which influence its movement etc. are critical for both traders and investors to make informed decisions in the equity markets . With this said , understanding its limitations and considering other market indicators is equally important for making a comprehensive investment plan. Tracking and analyzing the index provides valuable insights into the Indian equity market’s dynamics and potential, ultimately aiding informed decisions for financial growth.